Hi Inistate community! ![]()
Let’s explore how to view and add charts to your workspace dashboard.
In this tutorial, you will learn how Workspace Admins can create and add charts to the dashboard and how users can view them. Charts provide a clear visual representation of data, making it easier to track and analyze important metrics.
How to Add Charts
Workspace Admins have the exclusive ability to create and add charts to the dashboard. Follow these steps:
-
Log in as Workspace Admin
Ensure you’re logged in with Workspace Admin role. -
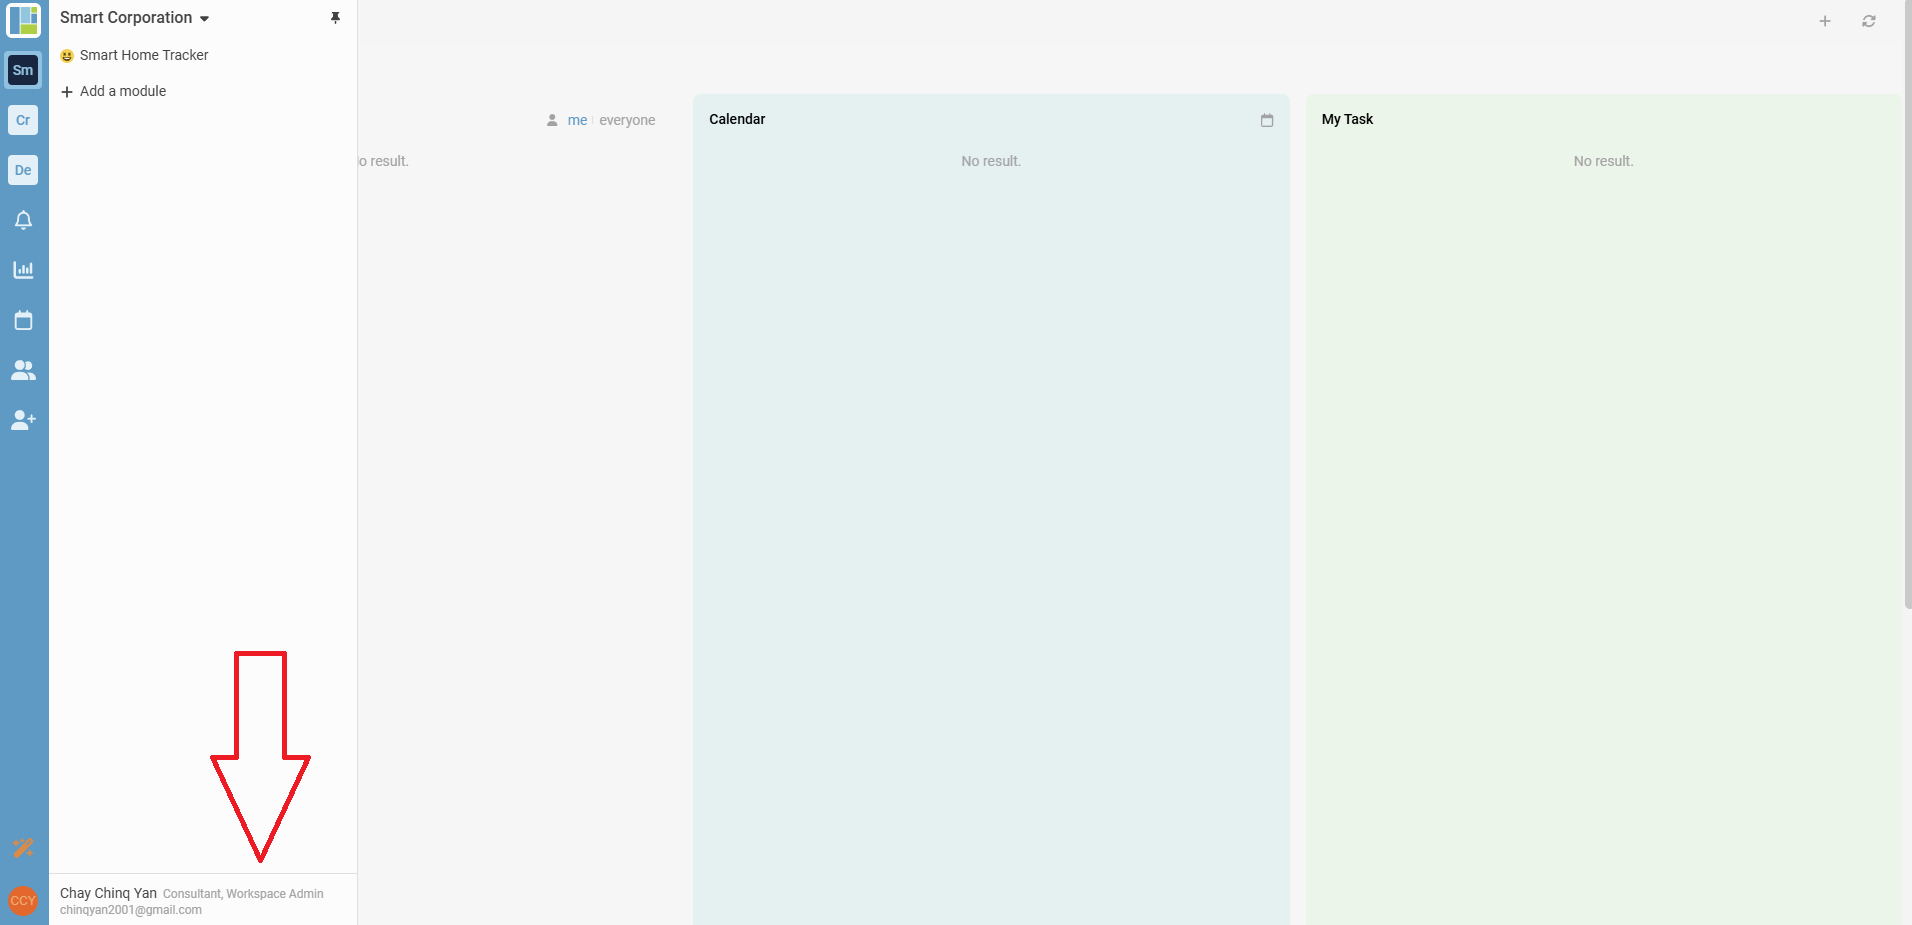
Navigate to the Dashboard
On the sidebar, go to the dashboard section in your workspace. -
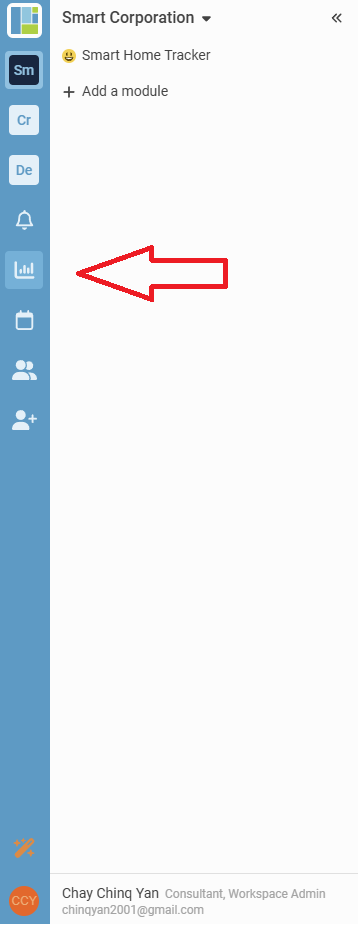
Create a Chart
Click the Analytics icon on top right of listing.Then click ‘Chart’
-
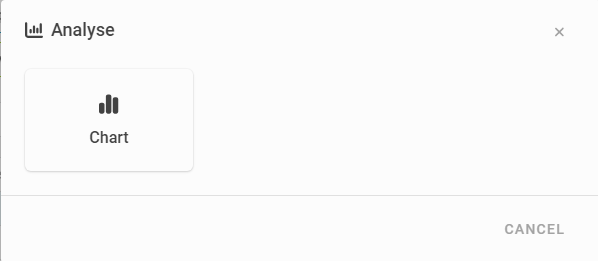
Select Chart
You will be greeted with this page, select ‘Chart’ to add your desired chart.5. Chart Personalization
We offer a variety of chart types to suit your needs, including:- Bar Chart
- Stacked Bar Chart
- Horizontal Bar Chart
- Stacked Horizontal Bar Chart
- Line Chart
- Pie Chart
- Doughnut Chart
- Content (BETA)
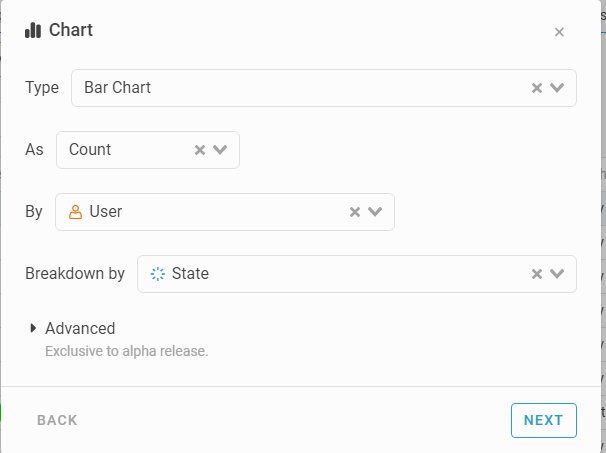
Steps to Configure Your Chart:
a. Select the desired chart type from the list.
b. Configure the chart by specifying:- Aggregate: Select how the data is calculated (e.g., sum, count, first [Beta]).
- Information: Select the data points to display on the chart.
- Breakdowns: Customize how data is segmented for clarity.
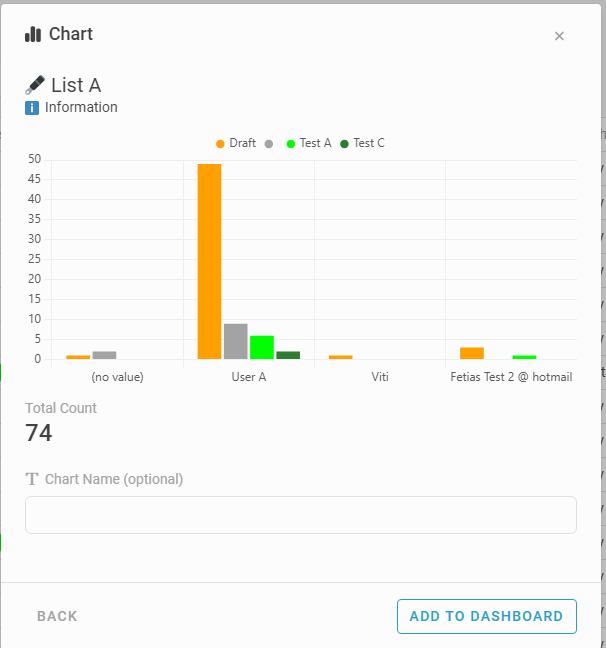
d. Click Net to view the Chart and
e. Enter or leave blank ‘Chart Name (optional)’ then click ‘Add to Dashboard’ to add the chart to the workspace dashboard or click ‘Back’ if do not want to add to dashboardHere’s an example of one of the chart configurations:
And this is how the chart appears:
After add to dashboard:


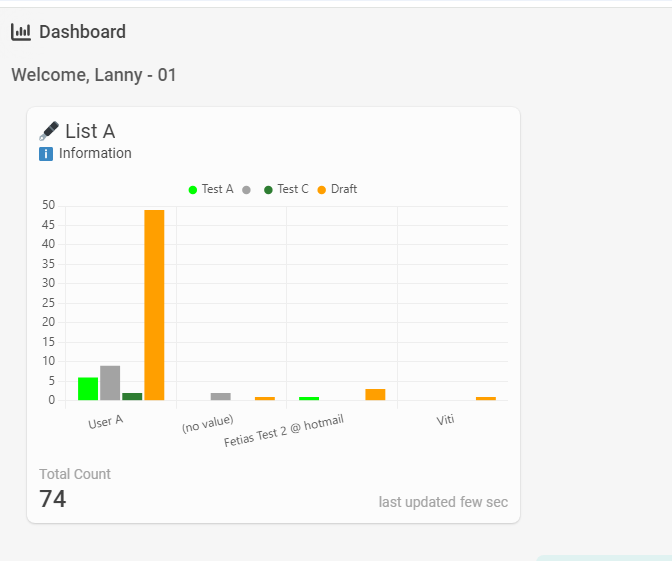
User View Based on Role: Web and Mobile Perspectives
This is what a user see on the web dashboard.
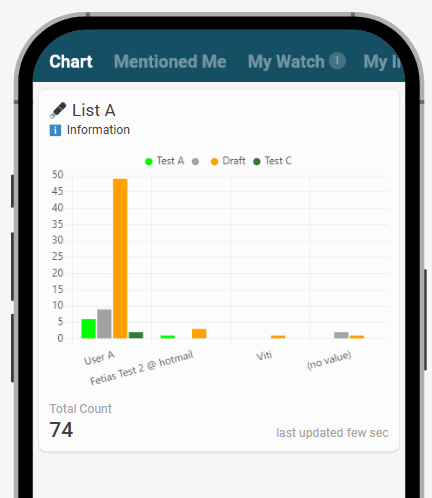
This is what a user without the Workspace Admin role sees on the mobile dashboard:
![]() Ready to create stunning charts? Let’s elevate your workspace dashboard with powerful visualizations! Feel free to contact us if you need assistance.
Ready to create stunning charts? Let’s elevate your workspace dashboard with powerful visualizations! Feel free to contact us if you need assistance. ![]()