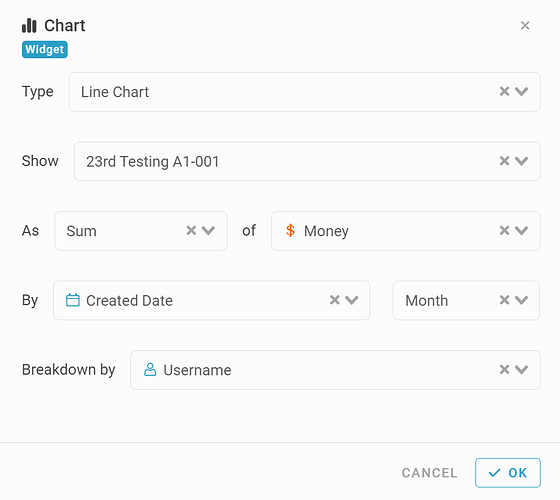
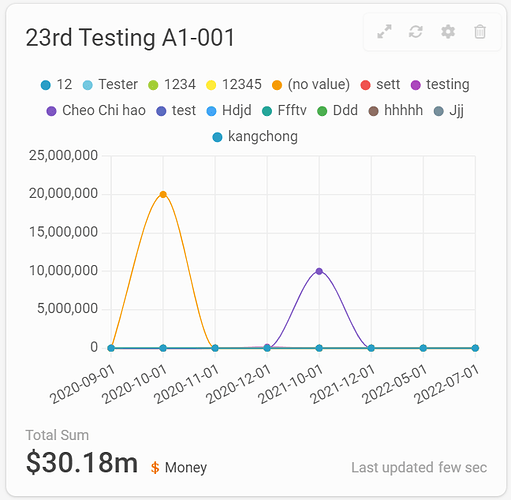
Hi community, this post will guide you on how to create a shortcut and chart on dashboard.
-
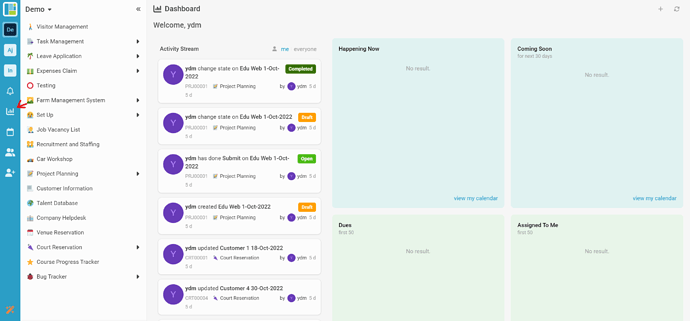
Go to ‘Dashboard’.
-
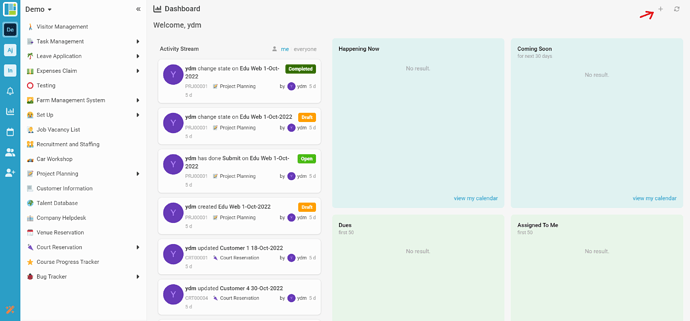
Click the ‘+’ button on dashboard.
-
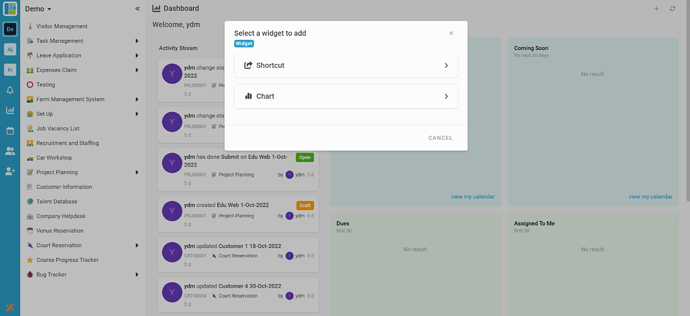
Select a widget (Shortcut or Chart) to add.
-
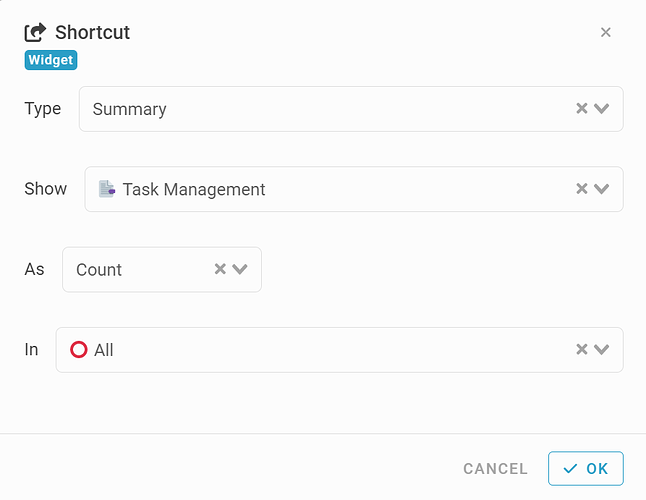
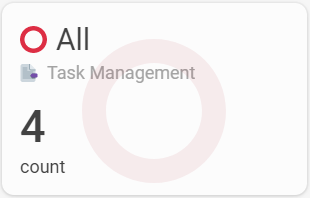
Example 1(Shortcut) - Summary
- Type: Summary
- Show: Module
- As: Count
- In: Listing in module
- Shortcut shown:
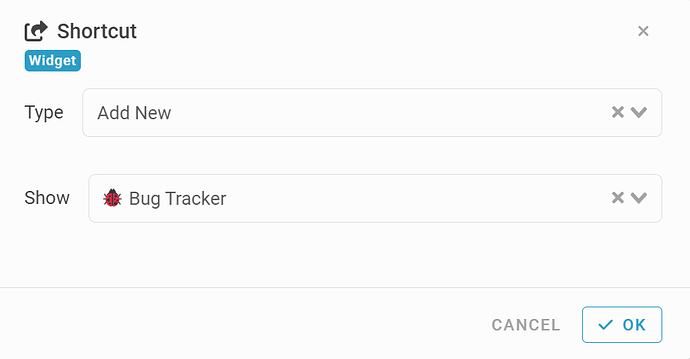
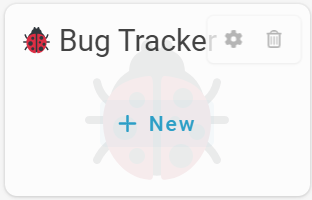
- Example 2(Shortcut) - Add New
- Type: Add New
- Show: Module
- Shortcut shown:
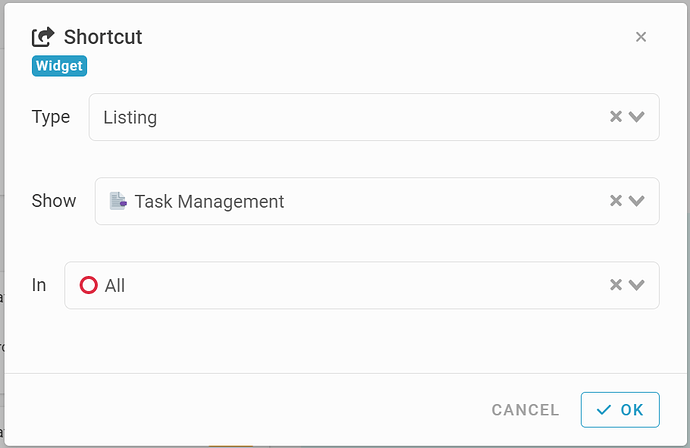
- Example 3(Shortcut) - Listing
- Type: Listing
- Show: Module
- In: Listing in module
- Shortcut shown:
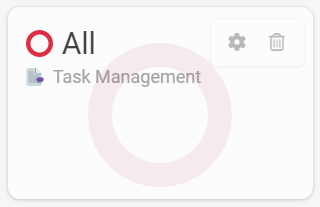
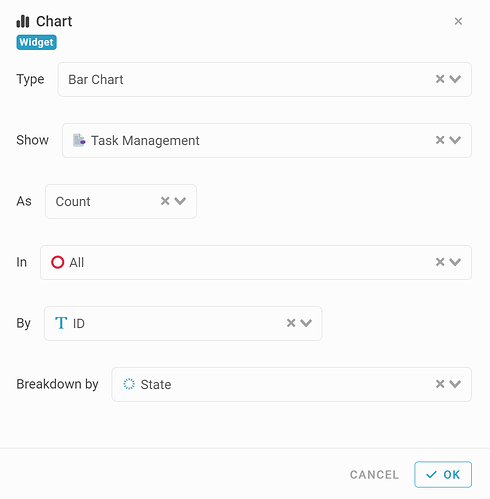
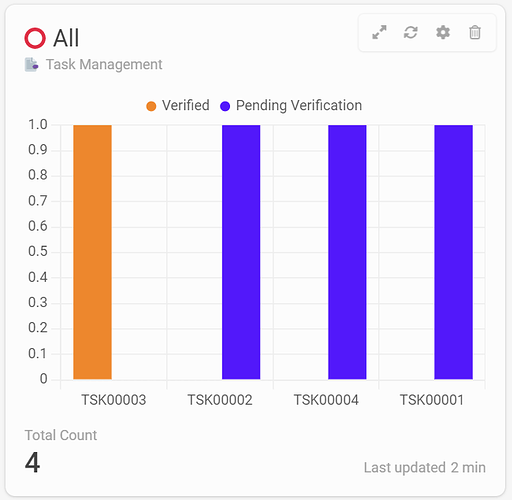
- Example 1(Chart) - Bar Chart
- Type: Bar Chart
- Show: Module
- As: Count
- In: Listing in module
- By: Information
- Breakdown by: Information (optional)
- Chart shown:
- Example 2(Chart) - Line Chart
- Type: Line Chart
- Show: Module
- As: Sum
- of: Information
- In: Listing in module
- By: Information
- Breakdown by: Information (optional)
- Chart shown:
